3QFY2019 Result Update | Dairy Products
February 12, 2019
Parag Milk Foods
BUY
CMP
`211
Performance Update
Target Price
`359
Y/E March (` cr)
3QFY19
3QFY18
% yoy
2QFY18
% qoq
Investment Period
12 Months
Net sales
601
519
15.7
573
4.7
EBITDA
62
59
5.7
58
6.8
EBITDA margin (%)
Stock Info
10.3
11.3
(97.2)
10.1
19.7
Adjusted PAT
31
25
20.6
30
1.0
Sector
Dairy Products
Market Cap (` cr)
1,758
For 3QFY2019, Parag Milk Foods (PMFL) posted healthy set of numbers,
Net Debt (` cr)
214
exceeding our expectations on bottom-line front. The company’s revenue grew by
Beta
1.1
~16% yoy, while the operating margins contracted by 97bps yoy. On the bottom-
52 Week High / Low
415/203
line front, PMFL reported growth of ~21% yoy to `31cr on the back of lower
Avg. Daily Volume
26,047
interest cost and taxes.
Face Value (`)
10
Healthy volume growth drives top-line: PMFL’s top-line grew by ~16% yoy due to
BSE Sensex
36,395
Nifty
10,889
strong growth in value added products like cheese, ghee, paneer, etc., which grew
Reuters Code
PAMF.NS
by ~19% yoy, whereas liquid milk registered growth of 11% yoy and skimmed milk
Bloomberg Code
PARAG.IN
grew by ~4% yoy.
Higher ad spends and employee costs impacted operating margin: On the
operating front, the company reported margin contraction of 97bps yoy at 10.3%,
Shareholding Pattern (%)
which is mainly due to an increase in ad spends & promotion expenses and
Promoters
46.0
investment in distribution network. On the bottom-line front, PMFL reported growth
MF / Banks / Indian Fls
12.1
of ~21% yoy to `31cr on the back of lower interest cost and taxes.
FII / NRIs / OCBs
15.3
Outlook and Valuation: Parag Milk Foods is anticipated to post strong growth in
Indian Public / Others
26.6
value added products on the back of its diversified product basket, strong brands
and wide distribution network. Further, PMFL would benefit from a shift in mix in
Abs. (%)
3m 1yr
3yr
favor of the organized market for dairy products. At the current market price, the
Sensex
3.9
6.2
50.5
company trades at a P/E of 11.8x its FY2020E EPS. Thus, we maintain our Buy
PARAG
(15.6)
(25.4)
-
recommendation on PMFL with Target Price of `359.
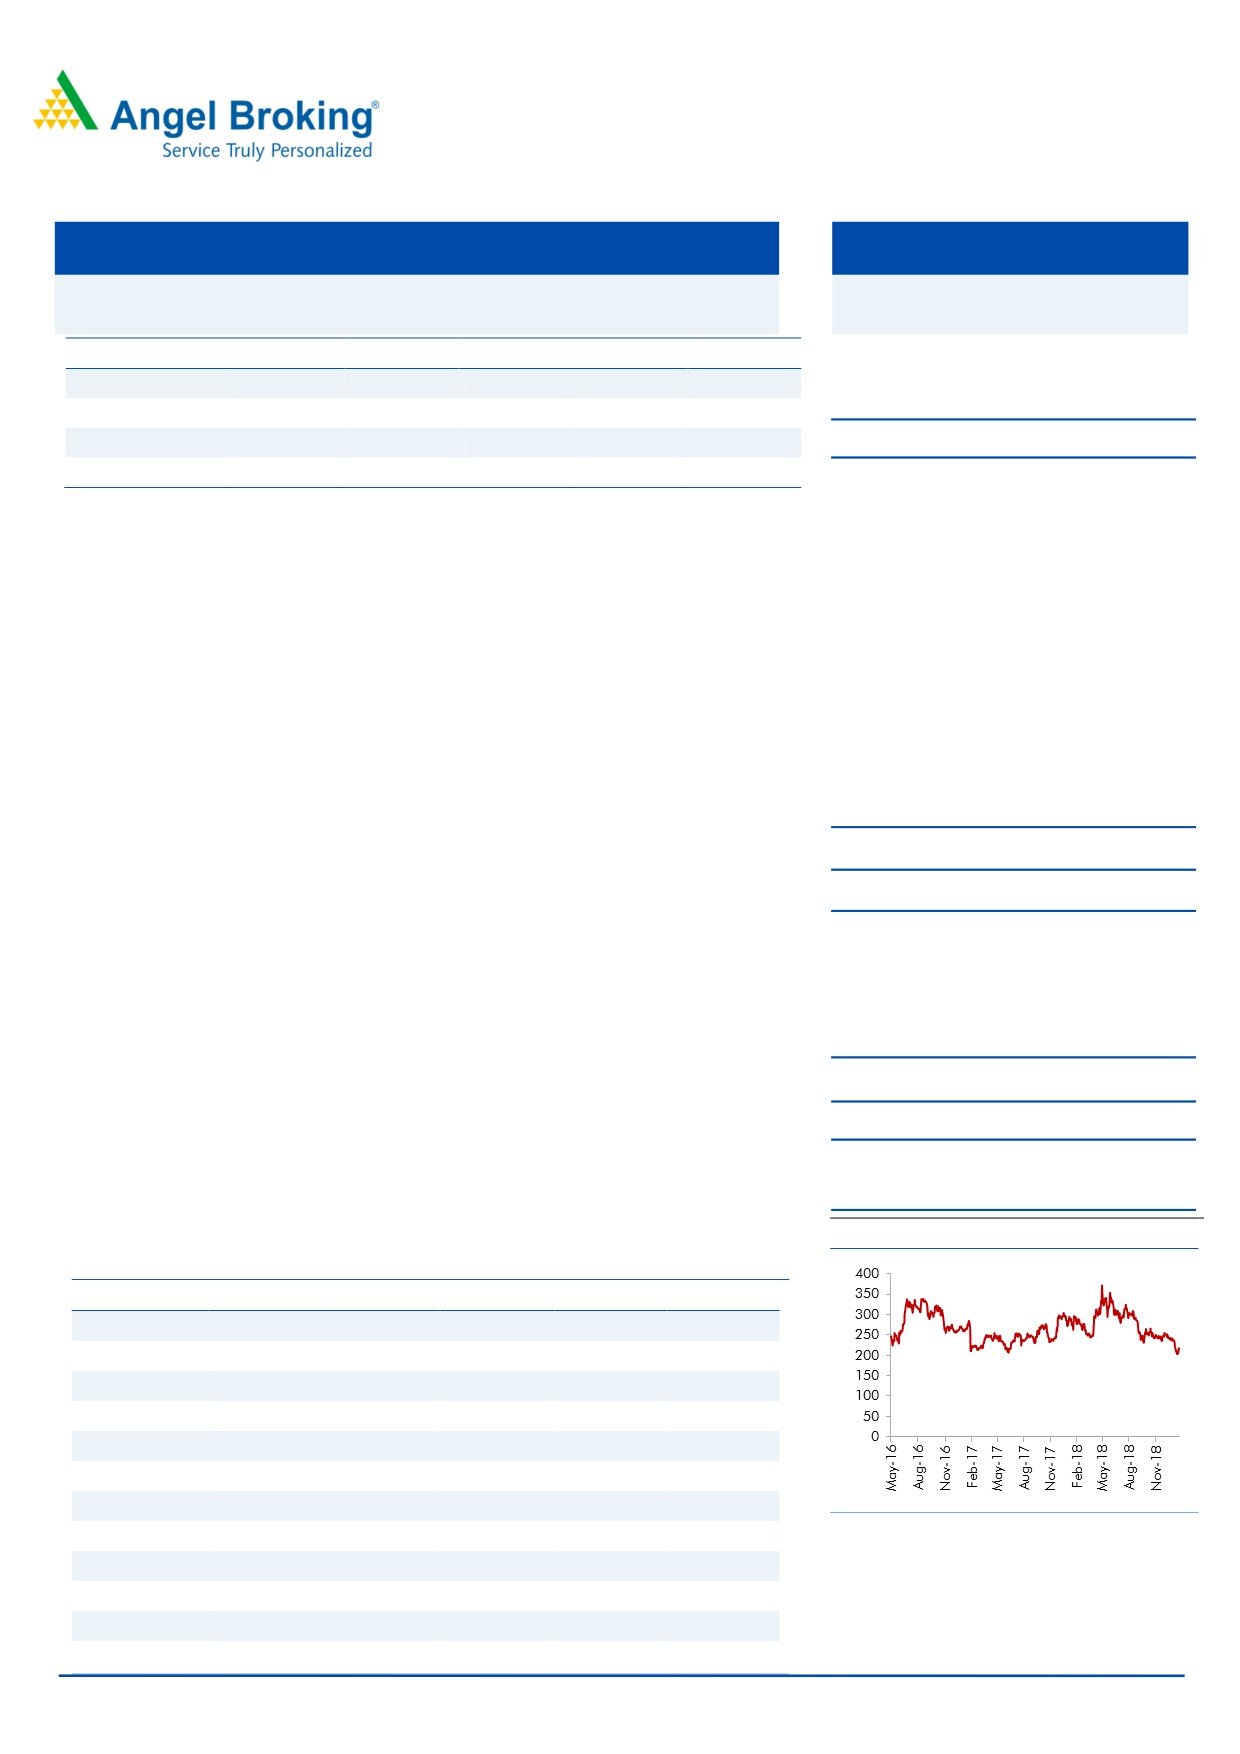
Price Chart
Key Financials
Y/E March (` cr)
FY2016
FY2017
FY2018
FY2019E
FY2020E
Net Sales
1,645
1,731
1,986
2,331
2,823
% chg
13.9
5.2
14.8
17.4
21.1
Net Profit
49.4
35.9
89.2
116.2
150.9
% chg
33.0
(27.2)
148.1
30.3
29.9
OPM (%)
9.0
5.1
10.0
10.4
10.6
EPS (Rs)
5.9
4.3
10.6
13.8
17.9
P/E (x)
36.0
49.4
19.9
15.3
11.8
Source: Company, Angel Research
P/BV (x)
5.8
3.2
2.8
2.4
2.1
RoE (%)
Amarjeet S Maurya
13.6
5.5
12.0
13.5
14.9
022 - 3935 7800 Ext: 6831
RoCE (%)
15.3
4.3
15.3
17.0
19.2
EV/Sales (x)
1.3
1.1
0.9
0.8
0.7
EV/EBITDA (x)
14.5
21.8
9.5
8.0
6.4
Please refer to important disclosures at the end of this report
1
Parag Milk Foods |3QFY2019 Result Update
Exhibit 1: 3QFY2019 Performance
Y/E March (` cr)
3QFY19
3QFY18
% chg. (yoy)
2QFY19
% chg. (qoq)
9MFY19
9MFY18
% chg
Net Sales
601
519
16
573
4.7
1,724
1,437
20.0
Net raw material
404.9
360
12.6
396.7
2.1
1184
1016
16.6
(% of Sales)
67.4
69.3
(185)
69.2
(176)
68.7
70.7
Employee Cost
25
18
38.4
23
9.3
69.11
53.12
30.1
(% of Sales)
4.2
3.5
69
4.1
18
4.0
3.7
Other Expenses
108
83
31.2
95
13.5
290.39
230.03
26.2
(% of Sales)
18.0
15.9
213
16.6
139
16.8
16.0
Total Expenditure
539
461
16.9
515
4.5
1,544
1,299
18.9
Operating Profit
62
59
5.7
58
6.8
180
138
30.3
OPM (%)
10.3
11.3
(97)
10.1
20
10.4
9.6
83
Interest
10
11
(4.6)
8
33.8
27.98
25.84
8.3
Depreciation
14
14
1.5
13
3.7
40.77
38.12
7.0
Other Income
1
2
(72.3)
1
(53.1)
3.93
7.65
(48.6)
PBT before exceptional
39
37
5.0
39
0.2
115
82
40.9
(% of Sales)
6.4
7.1
6.7
6.7
5.7
Exceptional Items
-
-
PBT
39
37
5.0
39
0.2
114.9
81.6
40.9
Tax
8
11
(30.2)
8
(2.8)
25.52
20.7
23.3
(% of PBT)
20.5
30.8
21.1
22.2
25.4
Reported PAT
31
25
20.6
30
1.0
89
61
46.8
PATM
5.1
4.9
5.3
5.2
4.2
Extra-ordinary Items
-
0
Adj PAT
31
25
20.6
30
1.0
89
61
46.8
Source: Company, Angel Research
February 12, 2019
2
Parag Milk Foods |3QFY2019 Result Update
Outlook and Valuation
Parag Milk Foods is anticipated to post strong growth in value added products on
the back of its diversified product basket, strong brands and wide distribution
network. Further, PMFL would benefit from a shift in mix in favor of the organized
market for dairy products. At the current market price, the company trades at a P/E
of 11.8x its FY2020E EPS. Thus, we maintain our Buy recommendation on PMFL
with Target Price of `359.
Risks to our estimates
1) Inability to procure sufficient good quality raw milk at commercially viable
prices.
2) Increase in competitive intensity.
February 12, 2019
3
Parag Milk Foods |3QFY2019 Result Update
Profit & Loss Statement
Y/E March (` cr)
FY2016
FY2017
FY2018
FY2019E
FY2020E
Total operating income
1,645
1,731
1,986
2,331
2,823
% chg
13.9
5.2
14.8
17.4
21.1
Total Expenditure
1,497
1,642
1,788
2,089
2,524
Raw Material
1,333
1,414
1,703
1,800
2,174
Personnel
67
79
85
98
119
Selling and Administration Expenses
82.4
113.1
-
144.5
175.0
Others Expenses
15
36
-
47
56
EBITDA
148
89
198
242
299
% chg
38.2
(40.1)
122.9
22.1
23.9
(% of Net Sales)
9.0
5.1
10.0
10.4
10.6
Depreciation& Amortisation
33
49
52
55
60
EBIT
115
40
146
186
240
% chg
44.1
(65.3)
267.3
27.3
28.7
(% of Net Sales)
7.0
2.3
7.4
8.0
8.5
Interest & other Charges
50
33
36
37
35
Other Income
2
11
9
6
5
(% of PBT)
2.3
62.7
7.9
3.9
2.4
Share in profit of Associates
-
-
-
-
-
Recurring PBT
67
18
119
155
210
% chg
94.9
(73.8)
581.0
29.8
35.3
Tax
19
0
30
39
59
(% of PBT)
29.2
2.3
25.3
25.0
28.0
PAT (reported)
47
17
89
116
151
Extraordinary Items
(2)
(19)
-
-
-
Less: Minority interest (MI)
0
0
0
0
0
PAT after MI (reported)
47
17
89
116
151
ADJ. PAT
49
36
89
116
151
% chg
33.0
(27.2)
148.1
30.3
29.9
(% of Net Sales)
3.0
2.1
4.5
5.0
5.3
Fully Diluted EPS (Rs)
5.9
4.3
10.6
13.8
17.9
% chg
33.0
(27.2)
148.1
30.3
29.9
February 12, 2019
4
Parag Milk Foods |3QFY2019 Result Update
Consolidated Balance Sheet
Y/E March (` cr)
FY2016
FY2017
FY2018
FY2019E
FY2020E
SOURCES OF FUNDS
Equity Share Capital
70
84
84
84
84
Reserves& Surplus
291
573
662
777
927
Shareholders’ Funds
362
657
746
861
1,011
Equity Share Warrants
-
-
-
-
-
Total Loans
389
262
212
234
234
Deferred Tax Liability
-
-
-
-
-
Other liabilities
18.7
18.1
18.1
18.1
18.1
Total Liabilities
769
938
976
1,113
1,263
APPLICATION OF FUNDS
Gross Block
528
585
645
705
765
Less: Acc. Depreciation
183
226
280
336
395
Net Block
345
359
365
369
370
Capital Work-in-Progress
28
21
24
24
24
Investments
0
-
-
-
-
Current Assets
602
878
965
1,096
1,311
Inventories
272
429
463
543
657
Sundry Debtors
236
215
245
287
348
Cash
8
101
105
86
88
Loans & Advances
85
133
153
180
218
Other Assets
-
-
-
-
-
Current liabilities
211
382
460
487
588
Net Current Assets
391
496
505
609
723
Deferred Tax Asset
(11)
(10)
(11)
(12)
(12)
Mis. Exp. not written off
17
73
94
123
160
Total Assets
769
938
976
1,113
1,263
February 12, 2019
5
Parag Milk Foods |3QFY2019 Result Update
Consolidated Cash Flow Statement
Y/E March (` cr)
FY2016
FY2017
FY2018
FY2019E FY2020E
Profit before tax
67
18
119
155
210
Depreciation
33
49
52
55
60
Change in Working Capital
0
0
(5)
(123)
(112)
Interest / Dividend (Net)
47
25
36
37
35
Direct taxes paid
(14)
(16)
(30)
(39)
(59)
Others
(75)
(11)
0
0
0
Cash Flow from Operations
59
64
172
86
133
(Inc.)/ Dec. in Fixed Assets
(27)
(97)
(60)
(60)
(60)
(Inc.)/ Dec. in Investments
(4)
6
(22)
(28)
(37)
Cash Flow from Investing
(31)
(91)
(82)
(88)
(97)
Issue of Equity
6
278
0
0
0
Inc./(Dec.) in loans
60
0
(50)
22
0
Dividend Paid (Incl. Tax)
0
0
0
0
0
Interest / Dividend (Net)
(55)
(31)
(36)
(37)
(35)
Cash Flow from Financing
(26)
123
(86)
(16)
(35)
Inc./(Dec.) in Cash
1
96
4
(18)
1
Opening Cash balances
4
5
101
105
86
Closing Cash balances
5
101
105
86
88
February 12, 2019
6
Parag Milk Foods |3QFY2019 Result Update
Key Ratios
Y/E March
FY2016
FY2017
FY2018
FY2019E FY2020E
Valuation Ratio (x)
P/E (on FDEPS)
36.0
49.4
19.9
15.3
11.8
P/CEPS
26.0
31.7
14.9
14.9
12.2
P/BV
5.8
3.2
2.8
2.4
2.1
Dividend yield (%)
0.1
0.2
0.0
0.0
0.0
EV/Sales
1.3
1.1
0.9
0.8
0.7
EV/EBITDA
14.5
21.8
9.5
8.0
6.4
EV / Total Assets
2.8
2.1
1.9
1.7
1.5
Per Share Data (`)
EPS (Basic)
5.9
4.3
10.6
13.8
17.9
EPS (fully diluted)
5.9
4.3
10.6
13.8
17.9
Cash EPS
9.6
7.9
16.7
16.7
20.4
DPS
0.2
0.4
0.1
0.1
0.1
Book Value
43.0
78.2
88.7
102.4
120.2
Dupont Analysis
EBIT margin
7.0
2.3
7.4
8.0
8.5
Tax retention ratio
0.7
1.0
0.7
0.8
0.7
Asset turnover (x)
2.2
2.1
2.3
2.3
2.4
ROIC (Post-tax)
10.9
4.8
12.8
13.8
14.9
Cost of Debt (Post Tax)
0.1
0.1
0.1
0.1
0.1
Returns (%)
ROCE
15.3
4.3
15.3
17.0
19.2
Angel ROIC (Pre-tax)
15.5
4.9
17.1
18.5
20.7
ROE
13.6
5.5
12.0
13.5
14.9
Turnover ratios (x)
Asset Turnover (Gross Block)
3.1
3.0
3.1
3.3
3.7
Inventory / Sales (days)
60
90
92
85
85
Receivables (days)
52
45
53
45
45
Payables (days)
58
99
102
99
99
Working capital cycle (ex-cash) (days)
55
37
43
31
31
Source: Company, Angel Research
February 12, 2019
7
Parag Milk Foods |3QFY2019 Result Update
Research Team Tel: 022 - 39357800
DISCLAIMER
Angel Broking Limited (hereinafter referred to as “Angel”) is a registered Member of National Stock Exchange of India Limited, Bombay
Stock Exchange Limited and Metropolitan Stock Exchange Limited. It is also registered as a Depository Participant with CDSL and
Portfolio Manager and Investment Adviser with SEBI. It also has registration with AMFI as a Mutual Fund Distributor. Angel Broking
Limited is a registered entity with SEBI for Research Analyst in terms of SEBI (Research Analyst) Regulations, 2014 vide registration
number INH000000164. Angel or its associates has not been debarred/ suspended by SEBI or any other regulatory authority for
accessing /dealing in securities Market. Angel or its associates/analyst has not received any compensation / managed or co-managed
public offering of securities of the company covered by Analyst during the past twelve months.
This document is solely for the personal information of the recipient, and must not be singularly used as the basis of any investment
decision. Nothing in this document should be construed as investment or financial advice. Each recipient of this document should
make such investigations as they deem necessary to arrive at an independent evaluation of an investment in the securities of the
companies referred to in this document (including the merits and risks involved), and should consult their own advisors to determine
the merits and risks of such an investment.
Reports based on technical and derivative analysis center on studying charts of a stock's price movement, outstanding positions and
trading volume, as opposed to focusing on a company's fundamentals and, as such, may not match with a report on a company's
fundamentals. Investors are advised to refer the Fundamental and Technical Research Reports available on our website to evaluate the
contrary view, if any
The information in this document has been printed on the basis of publicly available information, internal data and other reliable
sources believed to be true, but we do not represent that it is accurate or complete and it should not be relied on as such, as this
document is for general guidance only. Angel Broking Limited or any of its affiliates/ group companies shall not be in any way
responsible for any loss or damage that may arise to any person from any inadvertent error in the information contained in this report.
Angel Broking Limited has not independently verified all the information contained within this document. Accordingly, we cannot testify,
nor make any representation or warranty, express or implied, to the accuracy, contents or data contained within this document. While
Angel Broking Limited endeavors to update on a reasonable basis the information discussed in this material, there may be regulatory,
compliance, or other reasons that prevent us from doing so.
This document is being supplied to you solely for your information, and its contents, information or data may not be reproduced,
redistributed or passed on, directly or indirectly.
Neither Angel Broking Limited, nor its directors, employees or affiliates shall be liable for any loss or damage that may arise from or in
connection with the use of this information.
Disclosure of Interest Statement
Parag Milk Foods
1. Financial interest of research analyst or Angel or his Associate or his relative
No
2. Ownership of 1% or more of the stock by research analyst or Angel or associates or relatives
No
3. Served as an officer, director or employee of the company covered under Research
No
4. Broking relationship with company covered under Research
No
Ratings (Based on Expected Returns:
Buy (> 15%)
Accumulate (5% to 15%)
Neutral (-5 to 5%)
over 12 months investment period)
Reduce (-5% to -15%)
Sell (< -15%)
February 12, 2019
8